
numpy

Array represents Pic
need to install a third party library, pip install pillow, read pic --> convert by PIL --> save as another pic
Matpotlib
Partition and location
If I need more than one figure, how can I make it? Just like the figure below.
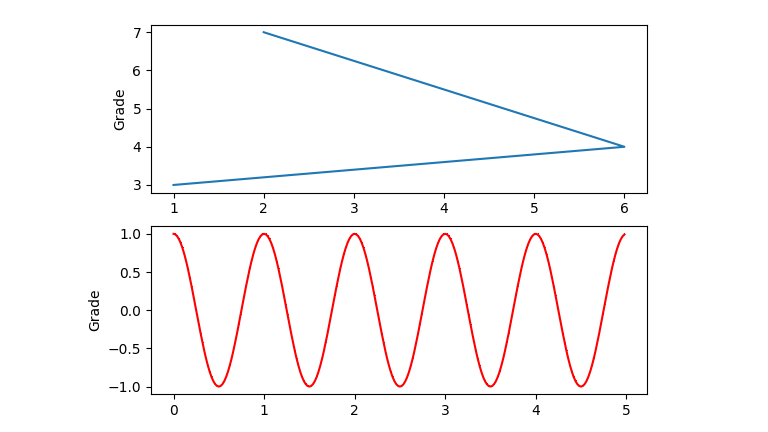
plt.subplot code
1 | pip install matpotlib # first use needing to intall the third party library |
more complex grid, use plt.subplot2grid(), just like the code below
1 | plt.subplot2grid((3,3),(0,0),colspan=3/rowspan=2) |
Or use matplotlib.gridspec, making a grid shown as in the figure below
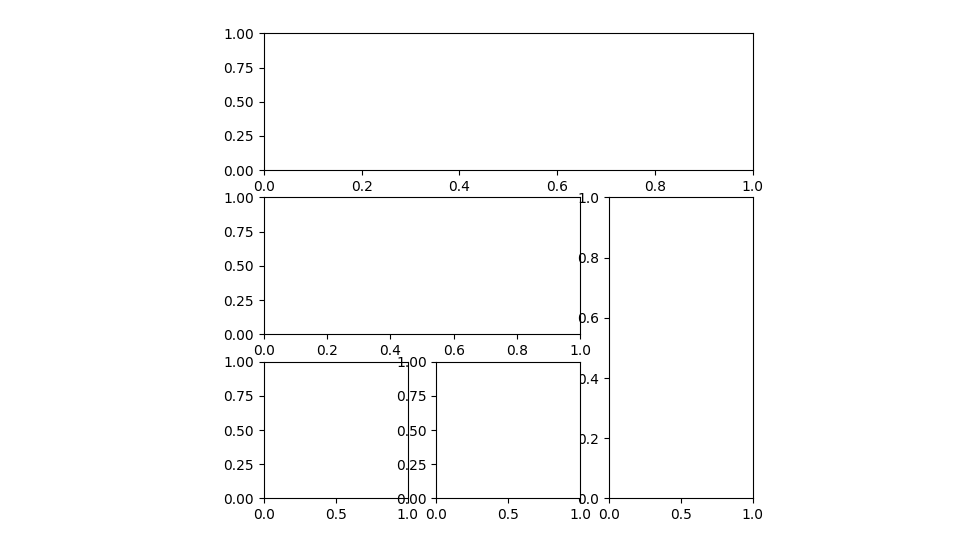
matplotlib.gridspec code
1 | import matplotlib.gridspec as gsp |
| 0 | 1 | 2 or -1 |
|---|---|---|
| 1 | ||
| 2 or -1 |
And what is the meaning of
Especially,‘,’ is a divider.
The left part represents the index of row, and the right part represent the index of column. Swaping the left and right part can lead to a block rotate 90 degrees.
Supporte Chinese
中文字体
| fontproperties | 中文字体 |
|---|---|
| Simhei | 黑体 |